Example run on Fetal Brain dataset#
These samples are from (La Manno et al., 2018) and you can download them from our Zeonodo repo: https://zenodo.org/record/7919631/files/fetal-brain-data.zip?download=1
Put them into a folder, lets say data/ and they will look like this:
10X_17_029
10X_17_028
or more detailed
data/10X_17_029
data/10X_17_029/outs
data/10X_17_029/outs/filtered_feature_bc_matrix
data/10X_17_029/outs/filtered_feature_bc_matrix/features.tsv.gz
data/10X_17_029/outs/filtered_feature_bc_matrix/barcodes.tsv.gz
data/10X_17_029/outs/filtered_feature_bc_matrix/matrix.mtx.gz
data/10X_17_028
data/10X_17_028/outs
data/10X_17_028/outs/filtered_feature_bc_matrix
data/10X_17_028/outs/filtered_feature_bc_matrix/features.tsv.gz
data/10X_17_028/outs/filtered_feature_bc_matrix/barcodes.tsv.gz
data/10X_17_028/outs/filtered_feature_bc_matrix/matrix.mtx.gz
So, the data folder contains two samples called, 10X_17_028 and 10X_17_029, these will be our samples names during the analyses and the results will be generated for two separate samples. You may change the sample names by simply changing the directory names if you like.
We can start a cellsnake minimal workflow which will generate the most basic outputs such as dimension reduction (PCA, UMAP and tSNE) and ClusTree plots for these two samples. We can inspect the outputs and if we are happy with the parameters, we can do a full run.
Run this command for a dry run, you will see the IDs of the detected samples under data folder and the outputs which will be created by cellsnake.
Start with a dry run#
cellsnake minimal data --dry
You should see something like below and many things that will be generated.
Job stats:
job                                    count    min threads    max threads
-----------------------------------  -------  -------------  -------------
all                                        1              1              1
create_initial_raw_rds_and_trimming        2              1              1
normalization_pca_rds                      2              1              1
plot_clustree                              2              1              1
plot_dimplots                              6              1              1
plot_some_metrics                          2              1              1
plot_some_technicals                       2              1              1
total                                     17              1              1
Looks fine, then trigger a minimal workflow run.
A minimal run#
cellsnake minimal data
Note
Cellsnake may install some R packages, be patient. When it finishes, you will get a results directory containing the analyses of two different fetal brain samples. analyses directory contains intermediate files, but the main results are always in results folder.
You will see two sample results like this which shows that both samples were processed using MT percent cut off of 10% and resolution parameter of 0.8.
results/10X_17_028/percent_mt~10/resolution~0.8
results/10X_17_029/percent_mt~10/resolution~0.8
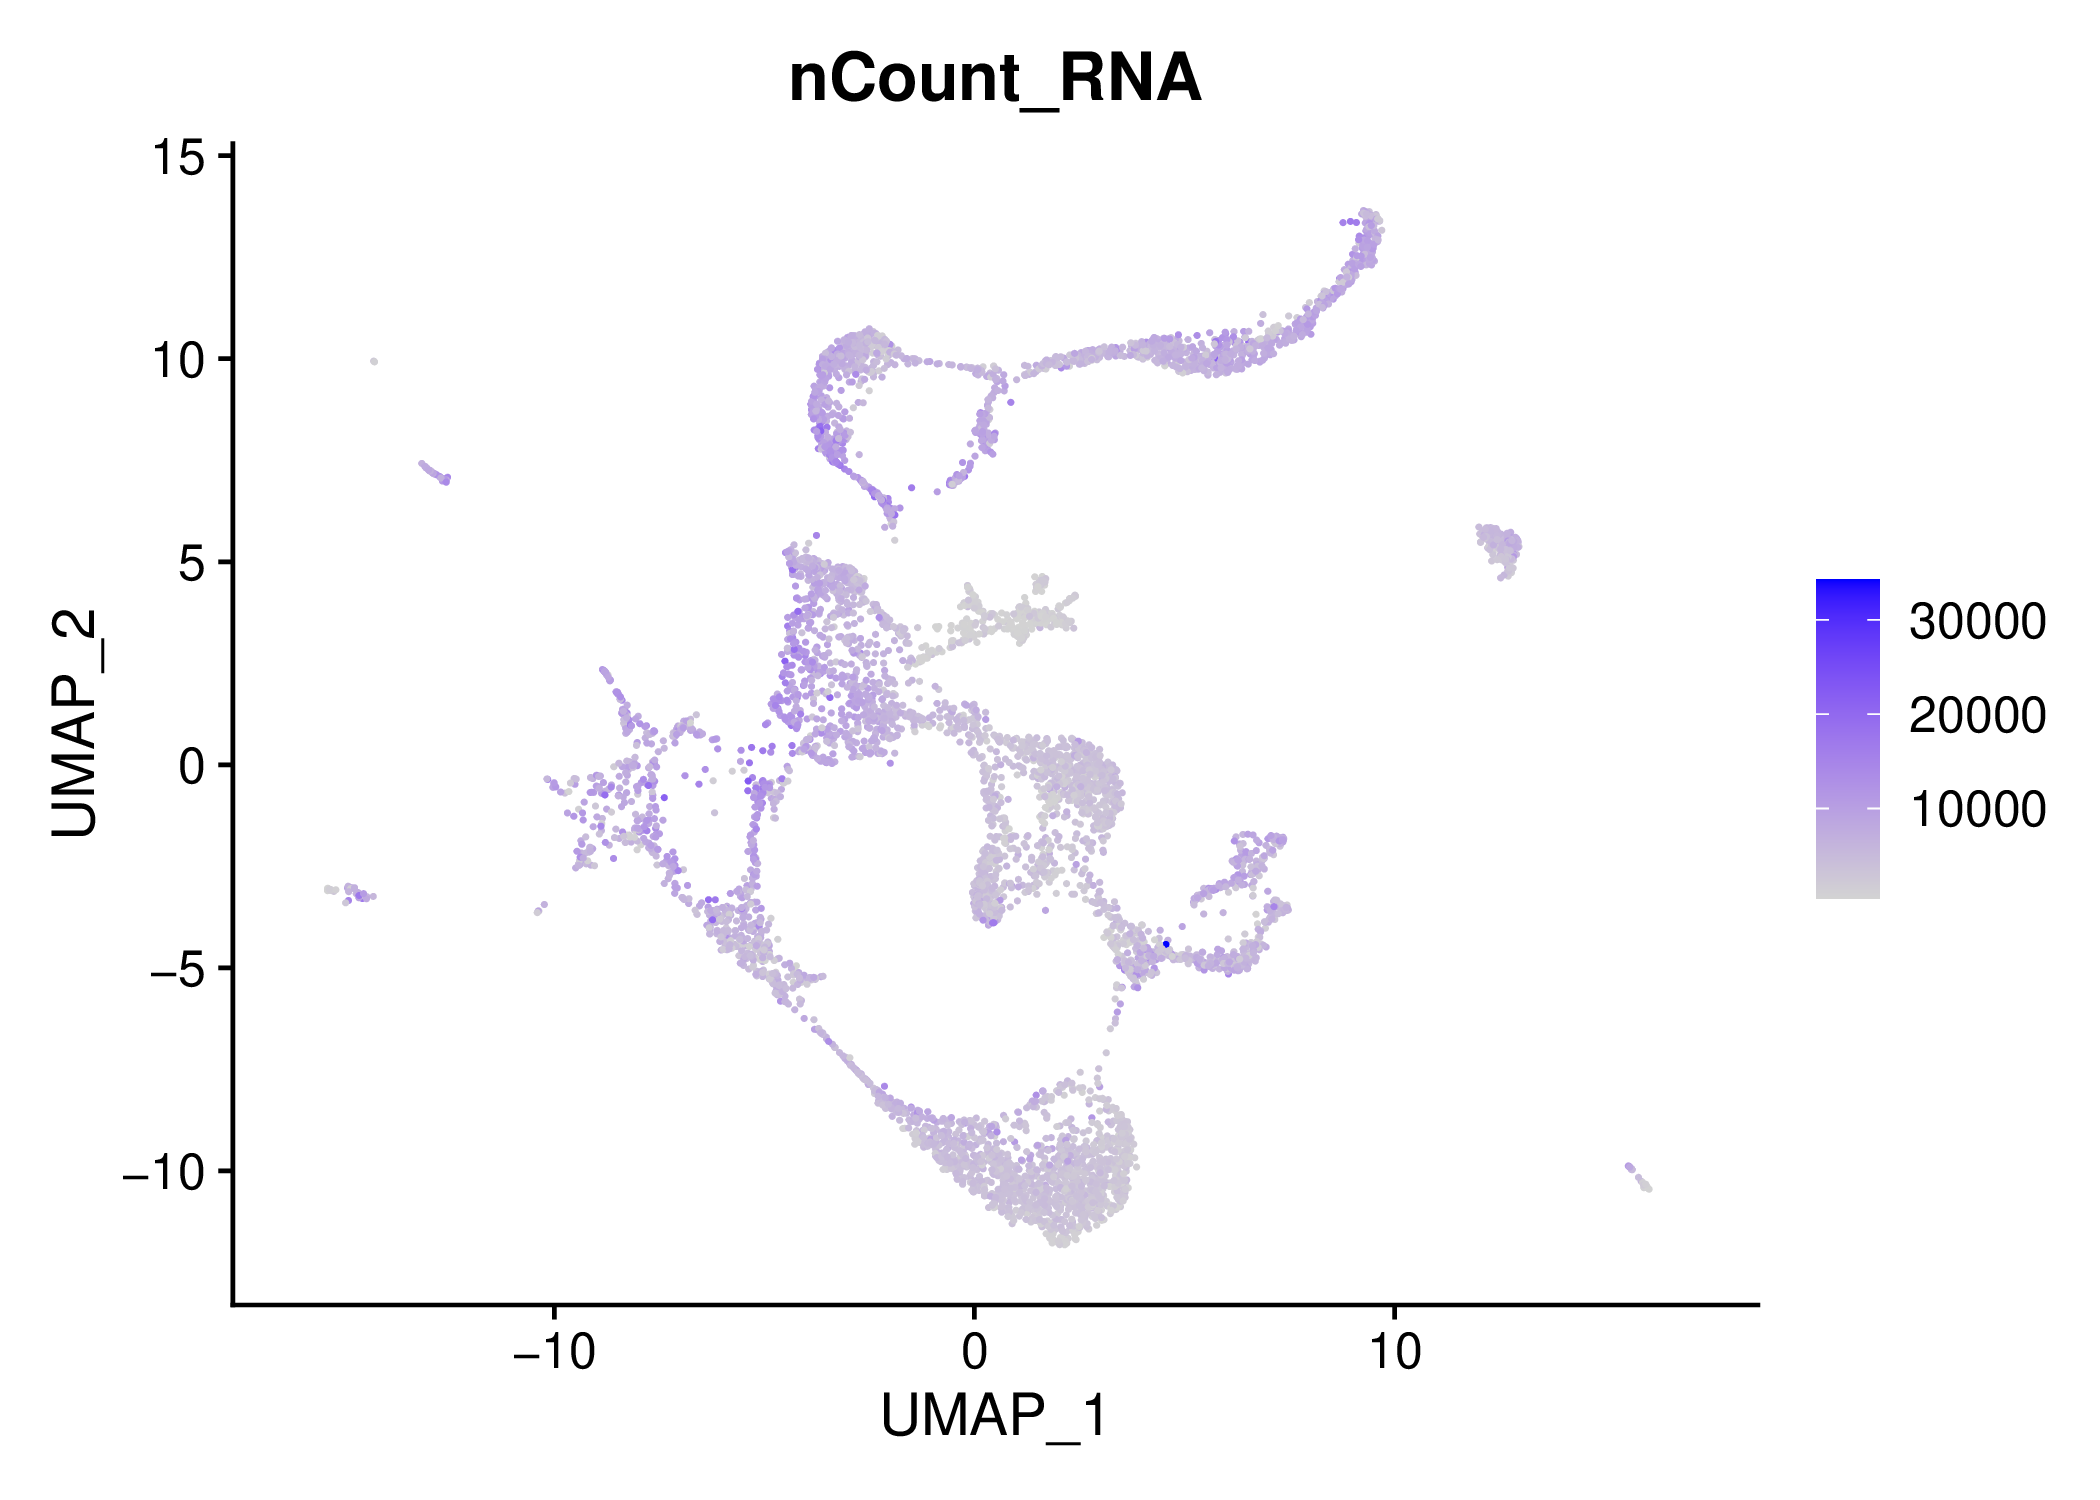
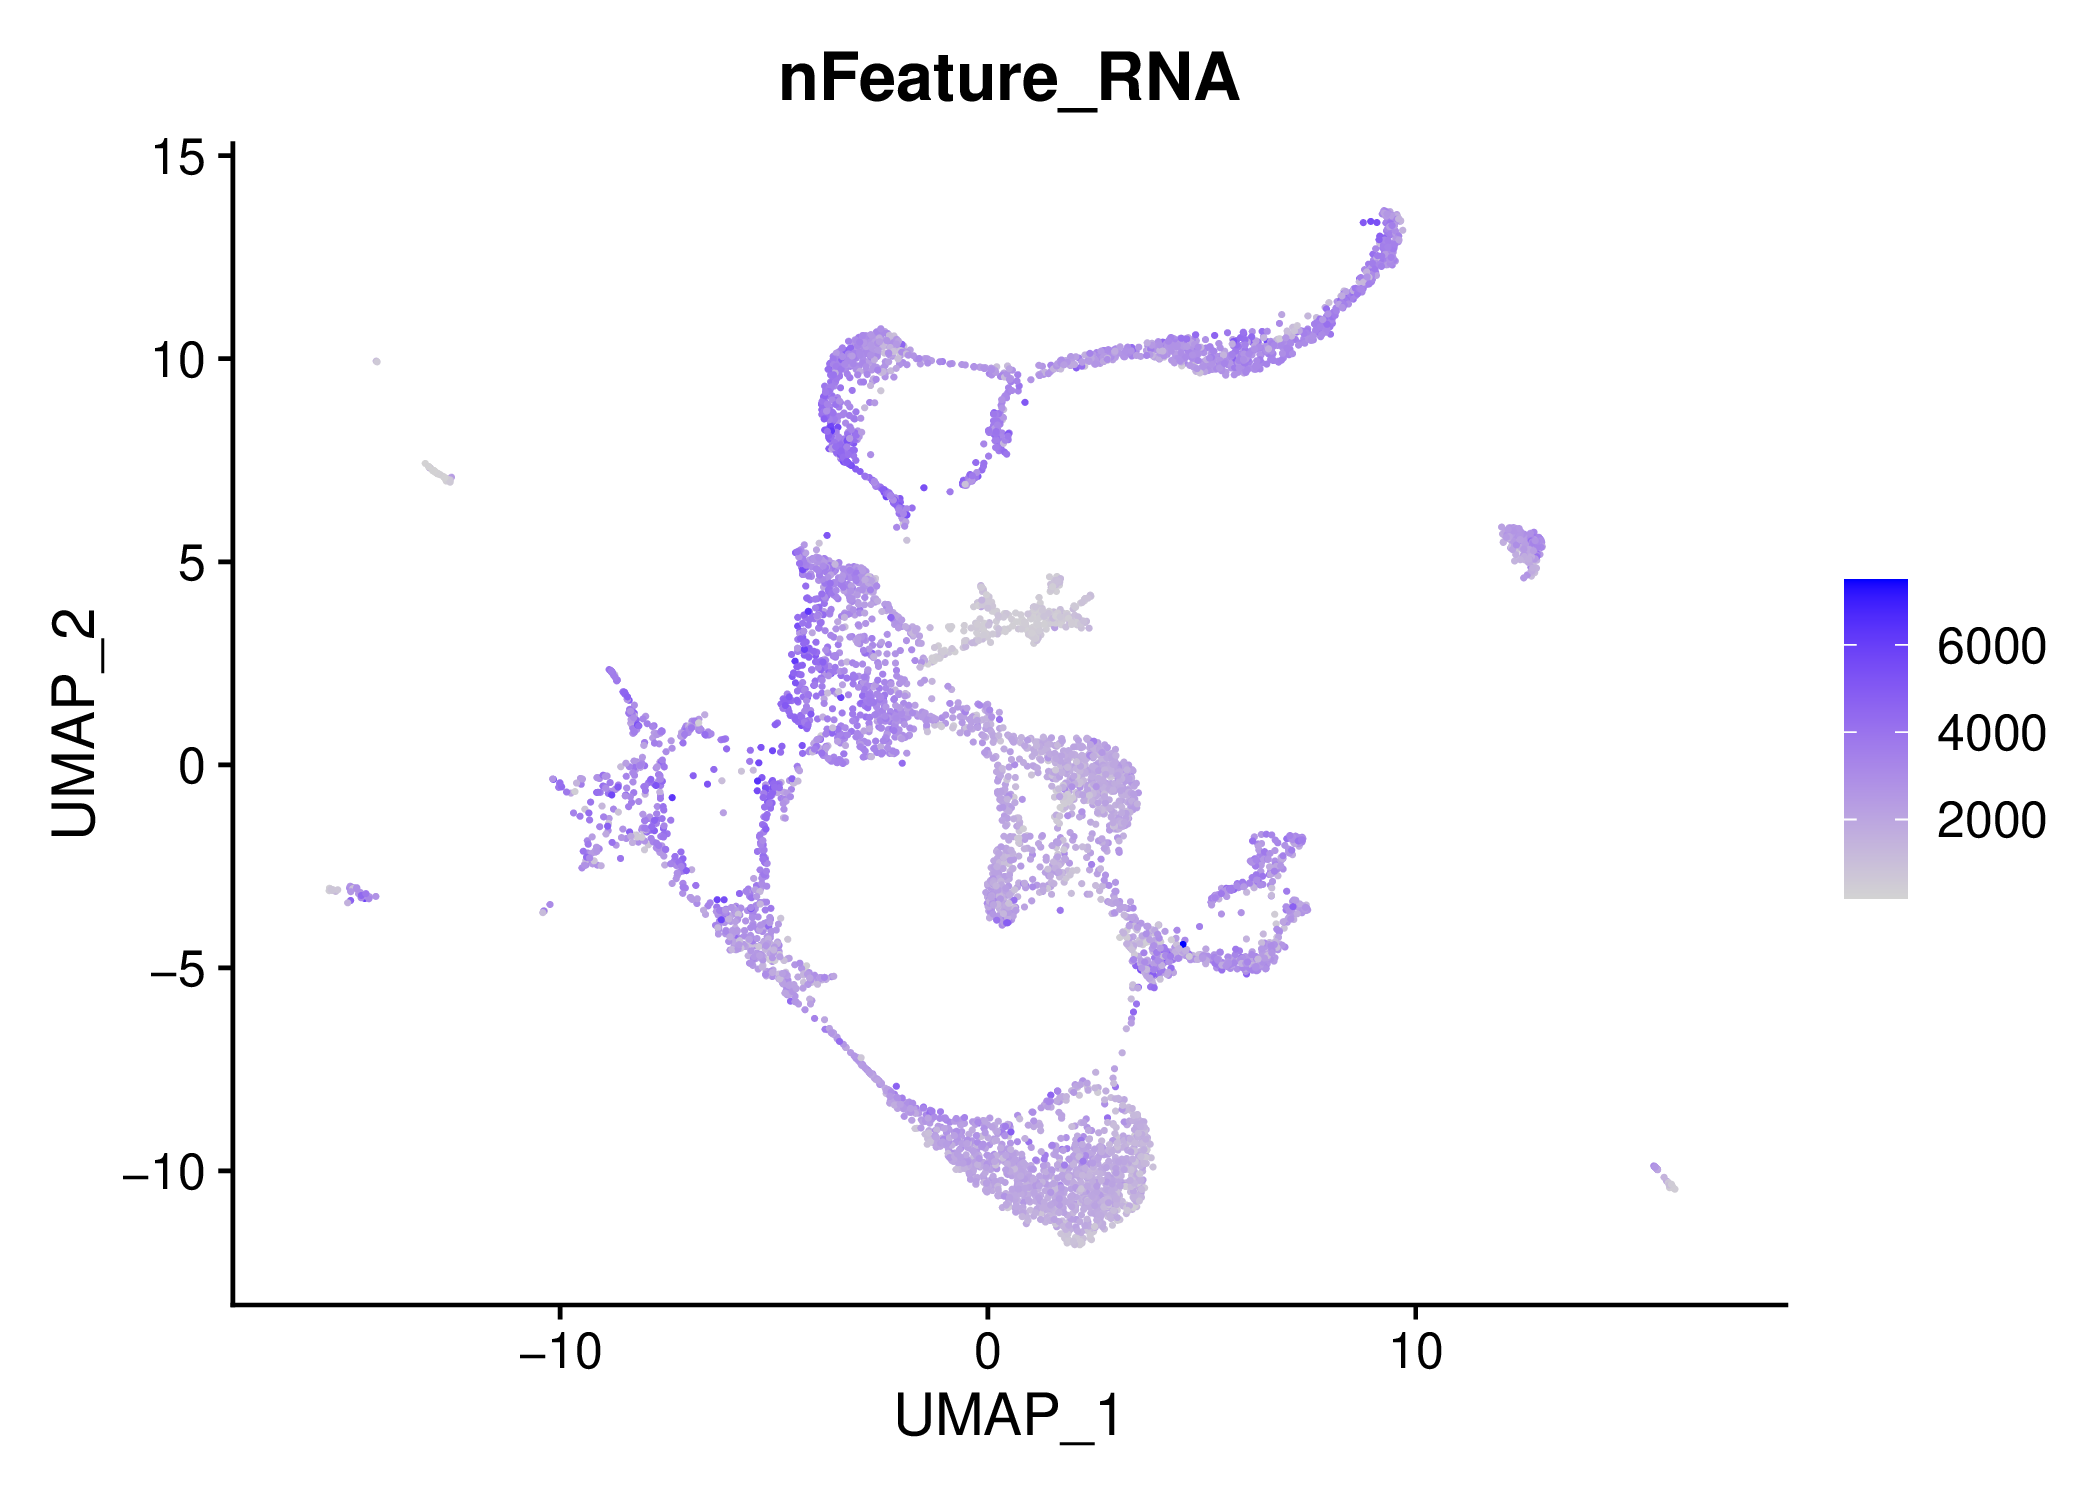
QC#
For example, you can inspect the QC filtering results by opening the results/10X_17_028/percent_mt~10/resolution~0.8/technicals/ files under.
Another important forlder for QC is results/10X_17_028/percent_mt~10/resolution~0.8/metrics/

If you are satisfied with the QC, you may directly integrate these two samples or you can continue with alternative parameters. (We recommend to clean unused directories or create another folder and continue there with the desired parameters.)
Run integration on seperately processed samples#
Lets integrate first
cellsnake integrate data
After finishes, we can now work on the integrated object, the integrated object by default located at analyses_integrated/seurat/integrated.rds, cellsnake warns you if it cannot detect the correct file.
Run a standard workflow on integrated object#
Now we tell cellsnake to work on the integrated object
#integrated object is by default located in this location.
cellsnake integrated standard analyses_integrated/seurat/integrated.rds
Note
Now you will see the results under the folder, here the MT percentage is auto because MT genes were already filtered per sample, so it wont be executed again. Do not confuse!
results_integrated/integrated/percent_mt\~auto/resolution\~0.8
Resolution parameter change granulation so clustering#
We can easily change the parameters, for example, lets use a different resolution, for example, 0.7 is a good resolution according to the clustree plot.

cellsnake integrated standard analyses_integrated/seurat/integrated.rds --resolution 0.7
Run an advanced workflow on integrated object#
You can generate additional analyses with advanced command.
cellsnake integrated advanced analyses_integrated/seurat/integrated.rds --resolution 0.7
Autoresolution is also possible#
It is also possible to use autoresolution on the integrated sample:
cellsnake integrated advanced analyses_integrated/seurat/integrated.rds --resolution auto